Timeline
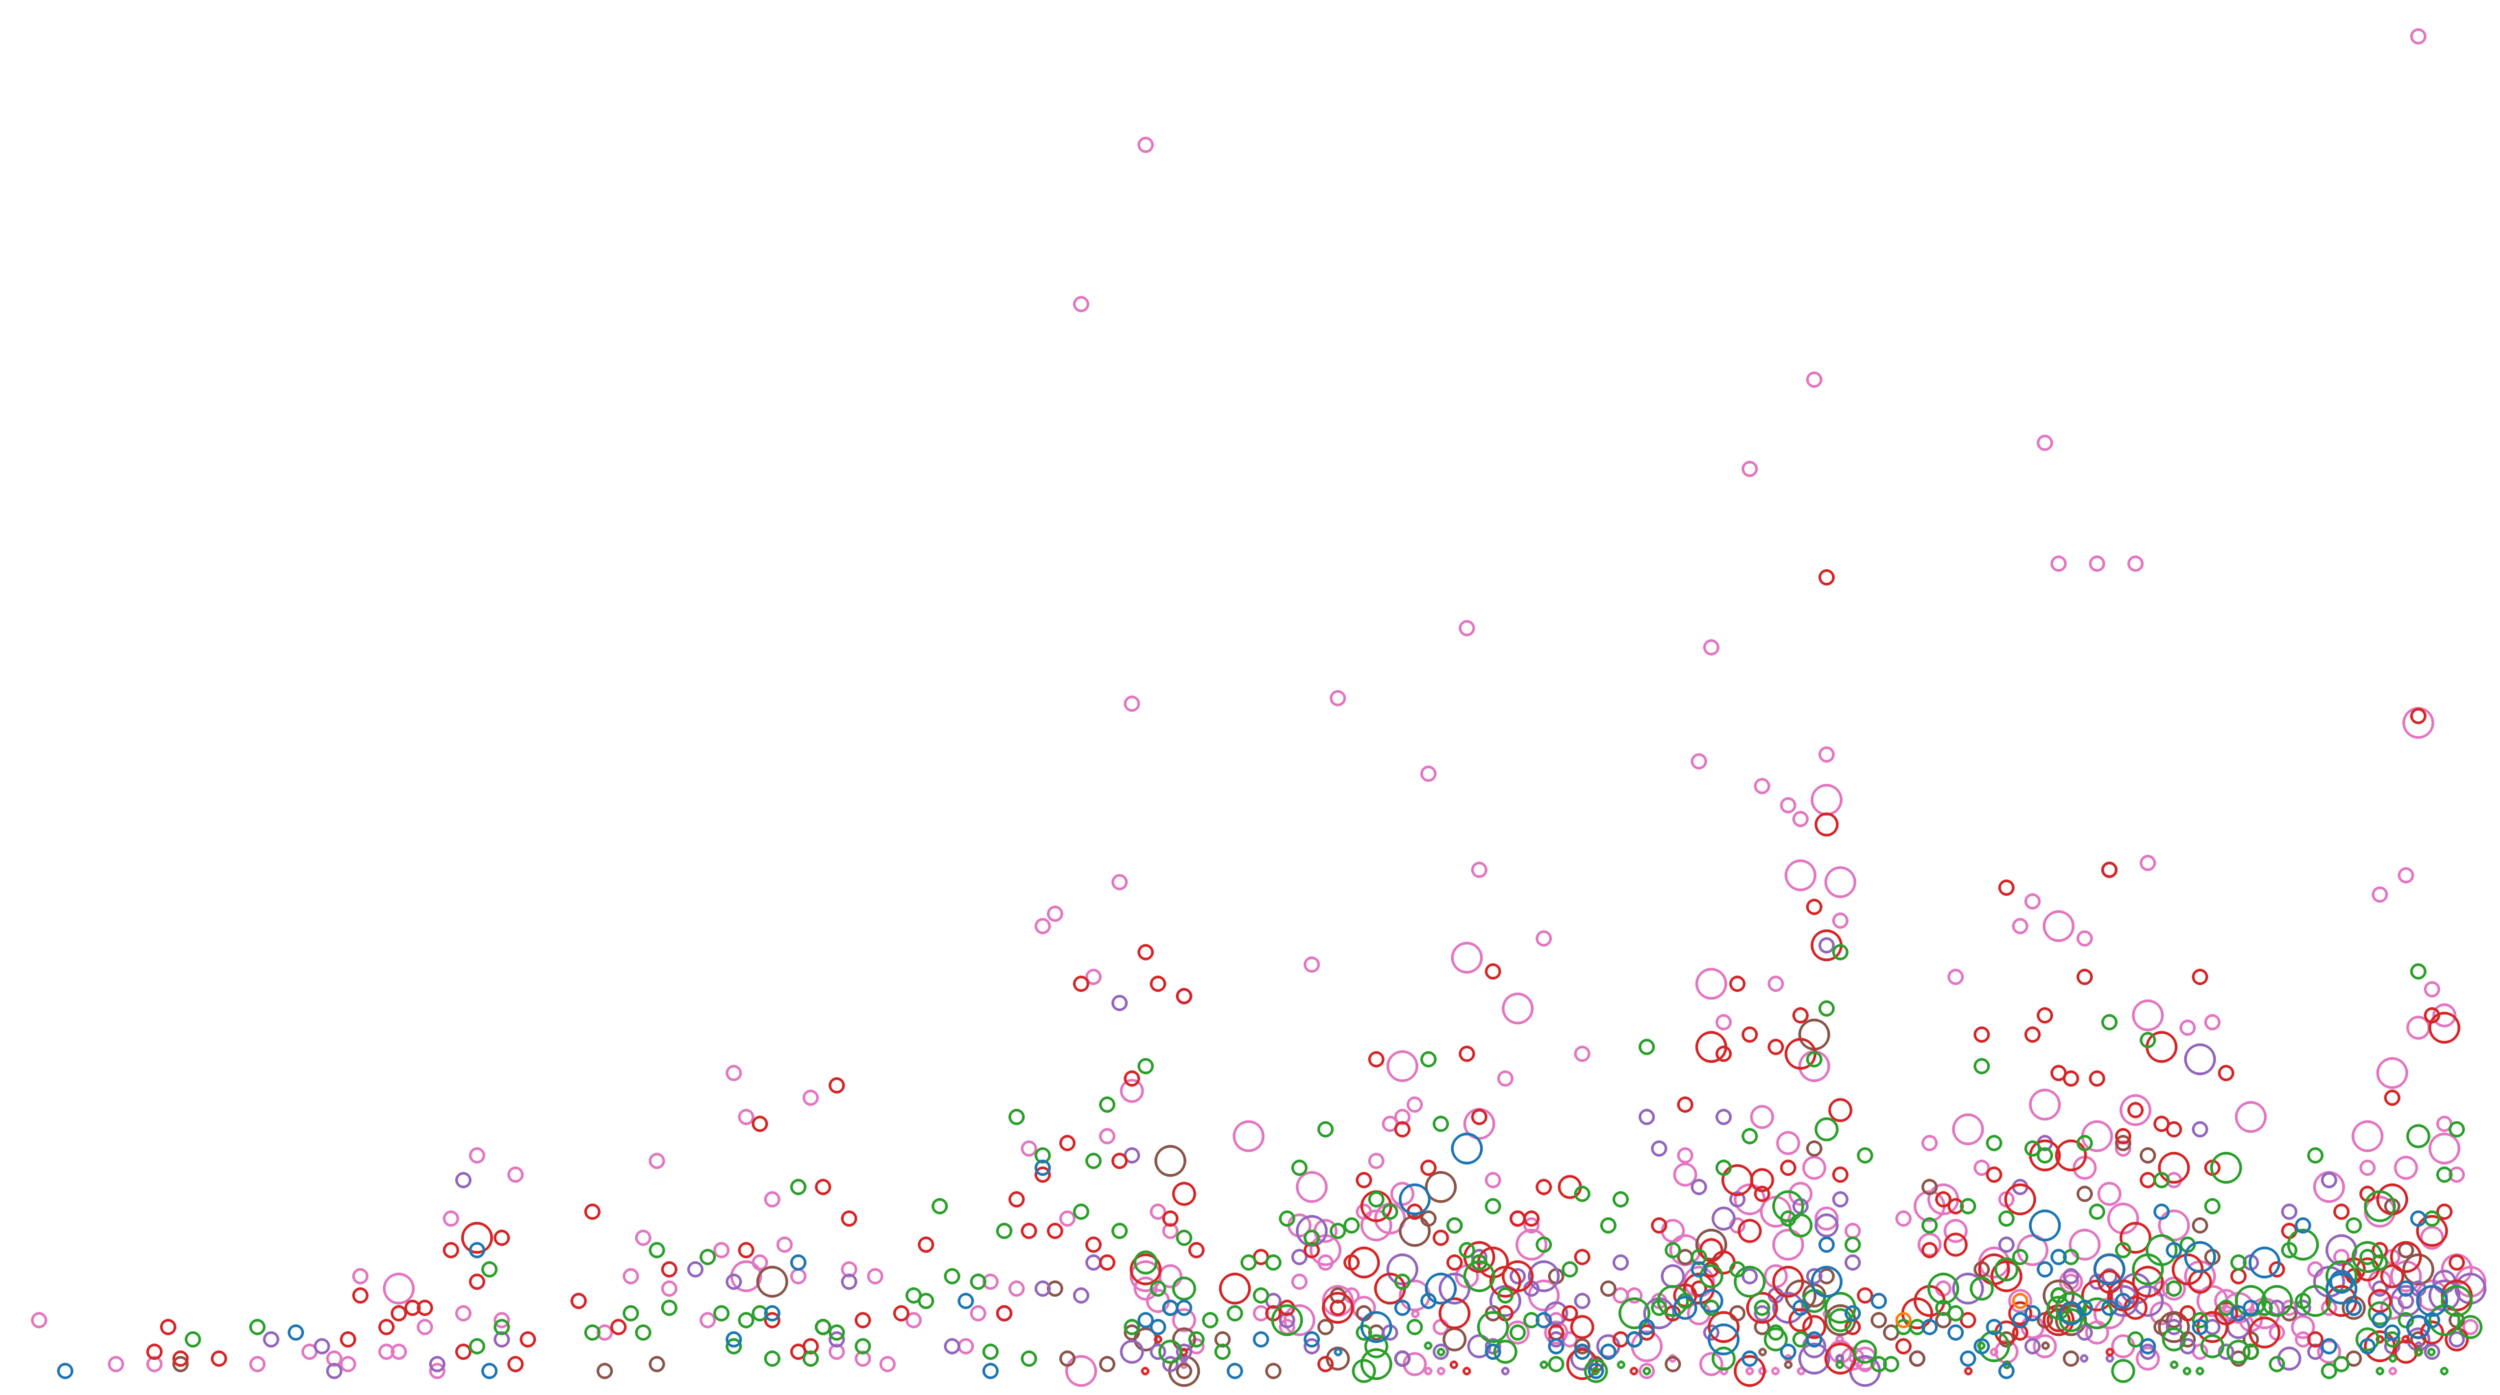
This scatter plot illustrates the growth of TEDx over time. The vertical axis represents the number of speakers and the horizontal axis represents the weeks since launch in March 2009. Each region is represented by a different color.
This scatter plot illustrates the growth of TEDx over time. The vertical axis represents the number of speakers and the horizontal axis represents the weeks since launch in March 2009. Each region is represented by a different color.